Applied Statistics - From data to results (Winter 2017-18)
 |
 |
 |
 |
 |
| Troels C. Petersen | Daniel S. Nielsen | Christian Michelsen | Vojtech Pacik | Stefan Hasselgren |
| Lecturer - Associate Professor | Assistant teacher - Ph.D. student | Assistant teacher - Ph.D. student | Assistant teacher - Ph.D. student | Contributor - master student |
| NBI - High Energy Physics | NBI - High Energy Physics | NBI - Machine Learning in physics | NBI - High Energy Physics | NBI - Machine Learning in HEP |
| Mac user | Windows & Linux user and expert | Linux user and expert | Mac user and expert | Windows & Linux user and expert |
| 35 52 54 42 / 26 28 37 39 | 51 88 55 40 | 50 48 30 95 | 28 25 56 96 | |
| petersen |
daniel9elsen |
christianmichelsen |
vojtech.pacik |
stefan.hasselgren |
Take-home exam:
The final take-home exam has been posted!
Hand in at www.eksamen.ku.dk by Friday 19th of January 2018 at 12:00.
Here is the associated problem 4.1 data file and a Python script for reading it.
Here is the associated problem 5.1 data file and a Python script for reading it.
Some advice for the exam can be found here: Applied Statistics take-home exam advice
What, when, where, prerequisites, books, curriculum and evaluation:
| Content: | Graduate statistics course giving an advanced introduction to statistics and data analysis. |
| Level: | Intended for students at 3rd-5th year of studies and new Ph.D. students. |
| Prerequisites: | Math (calculus and linear algebra) and programming experience (any language, but see below). |
| Note on prerequisites: Programming is an essential tool and necessary for the course!!! | |
| When: | Monday 9-12, Tuesday 13-17, and Friday 9-12 (Week Schedule Group B). |
| Where: | Lectures: Auditorium 6, Exercises: A110 + A111 (Tuesday Aud. 6 and A111) at HCO. |
| Period: | Blok 2 (20th of November 2017 - 19th of January 2018), 7.3 weeks total (missing a Monday and a Friday). |
| Format: | Shorter lectures followed by computer exercises, discussion, and occationally experiments. |
| Text book: | Roger Barlow: Statistics: A guide to the use of statistics. |
| Additional literature: | Philip R. Bevington: Data Reduction and Error Analysis, Glen Cowan: Statistical Data Analysis. |
| Programs used: | Simple Python (v2.7) (Python v3.5 is also OK) and a few packages on top. |
| Pensum/Curriculum: | The course curriculum can be found here. |
| Key words: | PDFs, Uncertainties, Correlation, Chi-Square, Likelihood, Fitting, Monte Carlo and Data Analysis. |
| Language: | English (occational Danish utterings!). All exercises, problem sets, exams, notes, etc. are in English. |
| Evaluation: | Problem set (15%), two projects (25%), and take-home exam (60%). |
| Exam: | Take-home (28 hour) exam given Thursday the 18th of January 2018 at 8:15. |
| Censur: | Internal censor evaluation (following the Danish 7-step scale) |
| Credits: | 7.5 ECTS (1/8 academic years work, that is 187.5-225 hours of work, thus 23-28 hours weekly). |
Before course start:
Further course information can be found here: Applied Statistics course information
Install Python and a few packages on top, and check that it runs!
Expected learning objectives of the course are discussed here: Learning objectives
A "course introduction" questionnaire can be found at: Applied Statistics 2017 Questionaire
List of things to be done by first day of course (Monday the 21st of November): Applied Statistics check list
Course outline:
Below is the preliminary course outline, subject to changes throughout the course.
Week 0: (Pre-course-start-session)
Nov 15: (11:15-14:00): Setting up Python, introduction, tips and trick to Python programming (Aud. A).
Nov 16: (11:15-14:00): Further introduction, tips and trick to Python programming (Aud. A).
Week 1 (Introduction, general concepts)
Nov 20: 8:15: Intro to course, photos, questionnaire and table measurements (Aud. A).
Central limit theorem. Mean, RMS and estimators. Correlation. Significant digits.
Nov 21: Error propagation (which is a science!) and short Python tutorial.
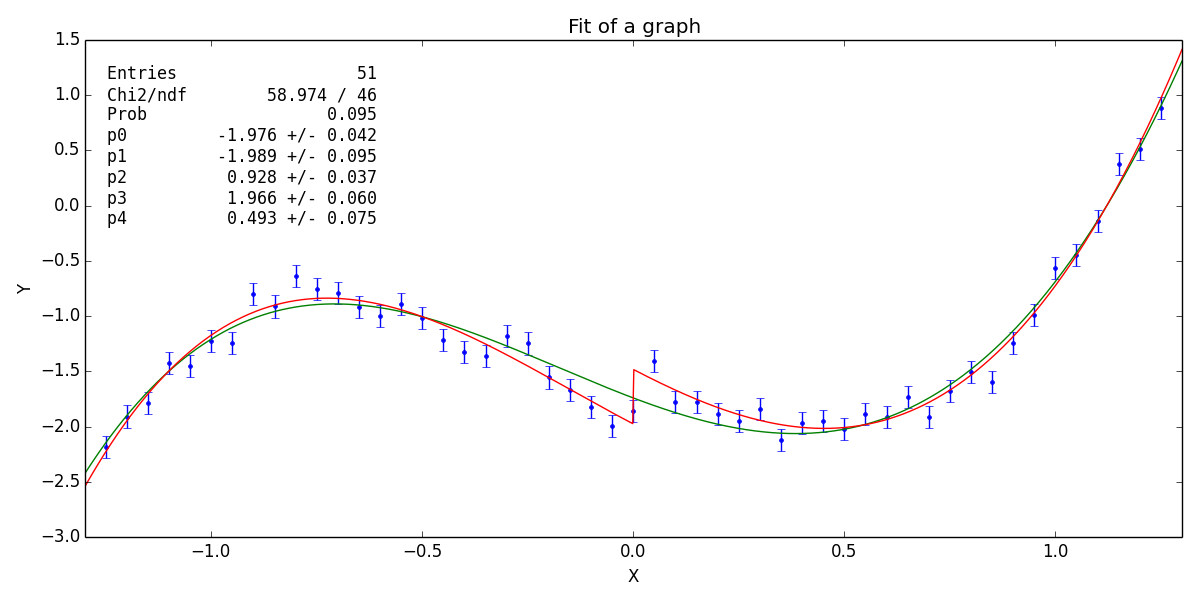
Nov 24: ChiSquare method (which plays a central role in the course!).
Form Project 1 groups. Estimate g measurement uncertainties.
Week 2 (ChiSquare, Systematic Errors)
Nov 27: 8:15: Start project 1 (for Thursday the 7th of December) doing experiments in First Lab.
Nov 28: Probability Density Functions (PDF) especially Binomial, Poisson and Gaussian. Writing "Weighted mean" function.
Dec 1: Analysis of "Table Measurement data" and discussion of real data analysis.
Week 3 (Likelihood, Fitting, Using Simulation):
Dec 4: Producing random numbers and their use in simulations.
Dec 5: Principle of maximum likelihood and (more) fitting/examples.
Introducing problem set and data (for noon Friday the 22nd of December).
Here is the associated problem 4.1 data file and a Python script for reading it.
Here is the associated problem 5.1 data file and a Python script for reading it.
Here is the associated problem 5.2 data file and a Python script for reading it.
Dec 8: Simulation exercises and summary (having handed in project 1 and residuals).
Week 4 (Hypothesis Testing and limits):
Dec 11: Hypothesis testing. Simple, Chi-Square, Kolmogorov and runs tests.
Dec 12: Limits and confidence intervals. Testing random numbers
Dec 15: Calibration and use of control channels. Table measurement solution.
Week 5 (Bayes Theorem and classification):
Dec 18: Bayes theorem and separating/classifying events. Analysis of testbeam data (part I). Evaluation of project 1 results.
Dec 19: Analysis of testbeam data (part II). Session on Problem Set.
Dec 22: Vacation - no serious teaching! Only requirement is an accepted subject and data for Project 2 (for Sunday the 14th of January).
For exam training, posting Exam2014.pdf
Week 6 (Multivariate Analysis):
Jan 1: More on hypothesis testing and Project 2 status. Just kidding - there is of course no teaching!
Jan 2: Multi-Variate Analysis (MVA) part I. The linear Fisher discriminant.
Jan 5: Multi-Variate Analysis (MVA) part II. Neural Networks, Decision Trees and other MVAs.
Week 7: (Advanced fitting and project 2)
Jan 8: Hypothesis testing and Project 2 work.
Jan 9: Advanced fitting and Project 2 work.
Jan 12: Planning of an experiment and Project 2 work. (Hand in Project 2 by Sunday 14th, 22:00).
Week 8 (Project 2 presentations and exam):
Jan 15: Project 2 presentations. Short deliberation on 2014 exam.
Jan 16: Project 2 presentations. Summary/repetition of course curriculum.
Jan 18: Exam given (posted on course webpage 8:15 in the morning).
Jan 19: 12:00 Exam to be handed in (on www.eksamen.ku.dk).
Week 9 (Returning exam):
Jan 26: 15:15-16:30ish+ (Aud. M): Exam solution, grades and course feedback.
Designing experiments (inspired by "A lady tasting tea") with beer tasting? Or just beer...
Notes and links:
In addition to the text book and other literature, some notes may be useful during the course:
Comments about course (biased selection!):
|
"This course overqualified me for a course on scientific
computing at Harvard the following Summer." [Dennis Christensen (2009 course)] "I recommended this course to everyone I know." [Pernille Yde (2009 course)] "I don't think that you can rightly call yourself a physicist, if you have not had a course of this type." [Bo Frederiksen (2010 course)] "My second project in the course led to an article now in review for Nature magazine!" [Ninna Rossen (2011 course)] "If you really want to understand your data, you need a course like this." [Julius Bier Kirkegaard (2012 course)] "I realized that I was very well prepared by this course, when I started working at CERN as a Summer Student." [Mathias Heltberg (2013 course)] "It is now many years ago, that I followed your course, but there is hardly a day, where I don't think about it" [Frederik Beyer (2011 course, in October 2014)] "This is without a doubt the single most useful, and possibly most influential, course I have taken during my university education. Thank you." [Samuel Walsh (2013 course, in December 2014)] "Tak for et fedt kursus. Naar jeg taenker tilbage paa mine 2.5 aars fysikstudier staar Anvendt Statistik frem som noget af det sjoveste og mest spaendende." [Martin Hayhurst Appel (2014 course)] "Every single sleepless night spent on this course has enriched my way of thinking." [Arianna Marchionne (2015 course)] "The best lecturer I had in my 3 years of studies in UCPH." [Anonymous (2016 course)] "I miss the course very much." [Niccolo Maffezzoli (instructor in 2015+2016 course, in 2017 as a PostDoc)] "I am able to confirm your course is very demanding but indeed worth working for, for I could spend another 7 weeks on this interesting curriculum!" [Jan de Boer 2017, upon having been told, that the course is demanding] "This course has been one of the most important aspects of my education so far. I have heard this from earlier students again and again - i am happy to say that i understand why now!" [Anonymous, Last line in the evaluation of 2017 course] |
Last updated 18th of March 2018.