Applied Statistics - Project 1
Project description:
Background description:
The ATLAS detector at CERNs new LHC accelerator is a very large and complex detector consisting of several layers of different detector types, which each perform a series of tasks, which in combination will allow the ATLAS collaboration to explore the proton collisions from the LHC. In order to test these detectors, and to charactarize and optimize them, all parts of the detector were put together as a "slice" of the ATLAS detector, and submitted to an extensive testbeam program. One of the main problems of the test beam was, that the composition of the beams in terms of particle types is not easily controlled by the accelerator people. It contains both electrons and pions, and so for each particle, it will have to be determined in situ which of the two it is. And that is now the task before you...
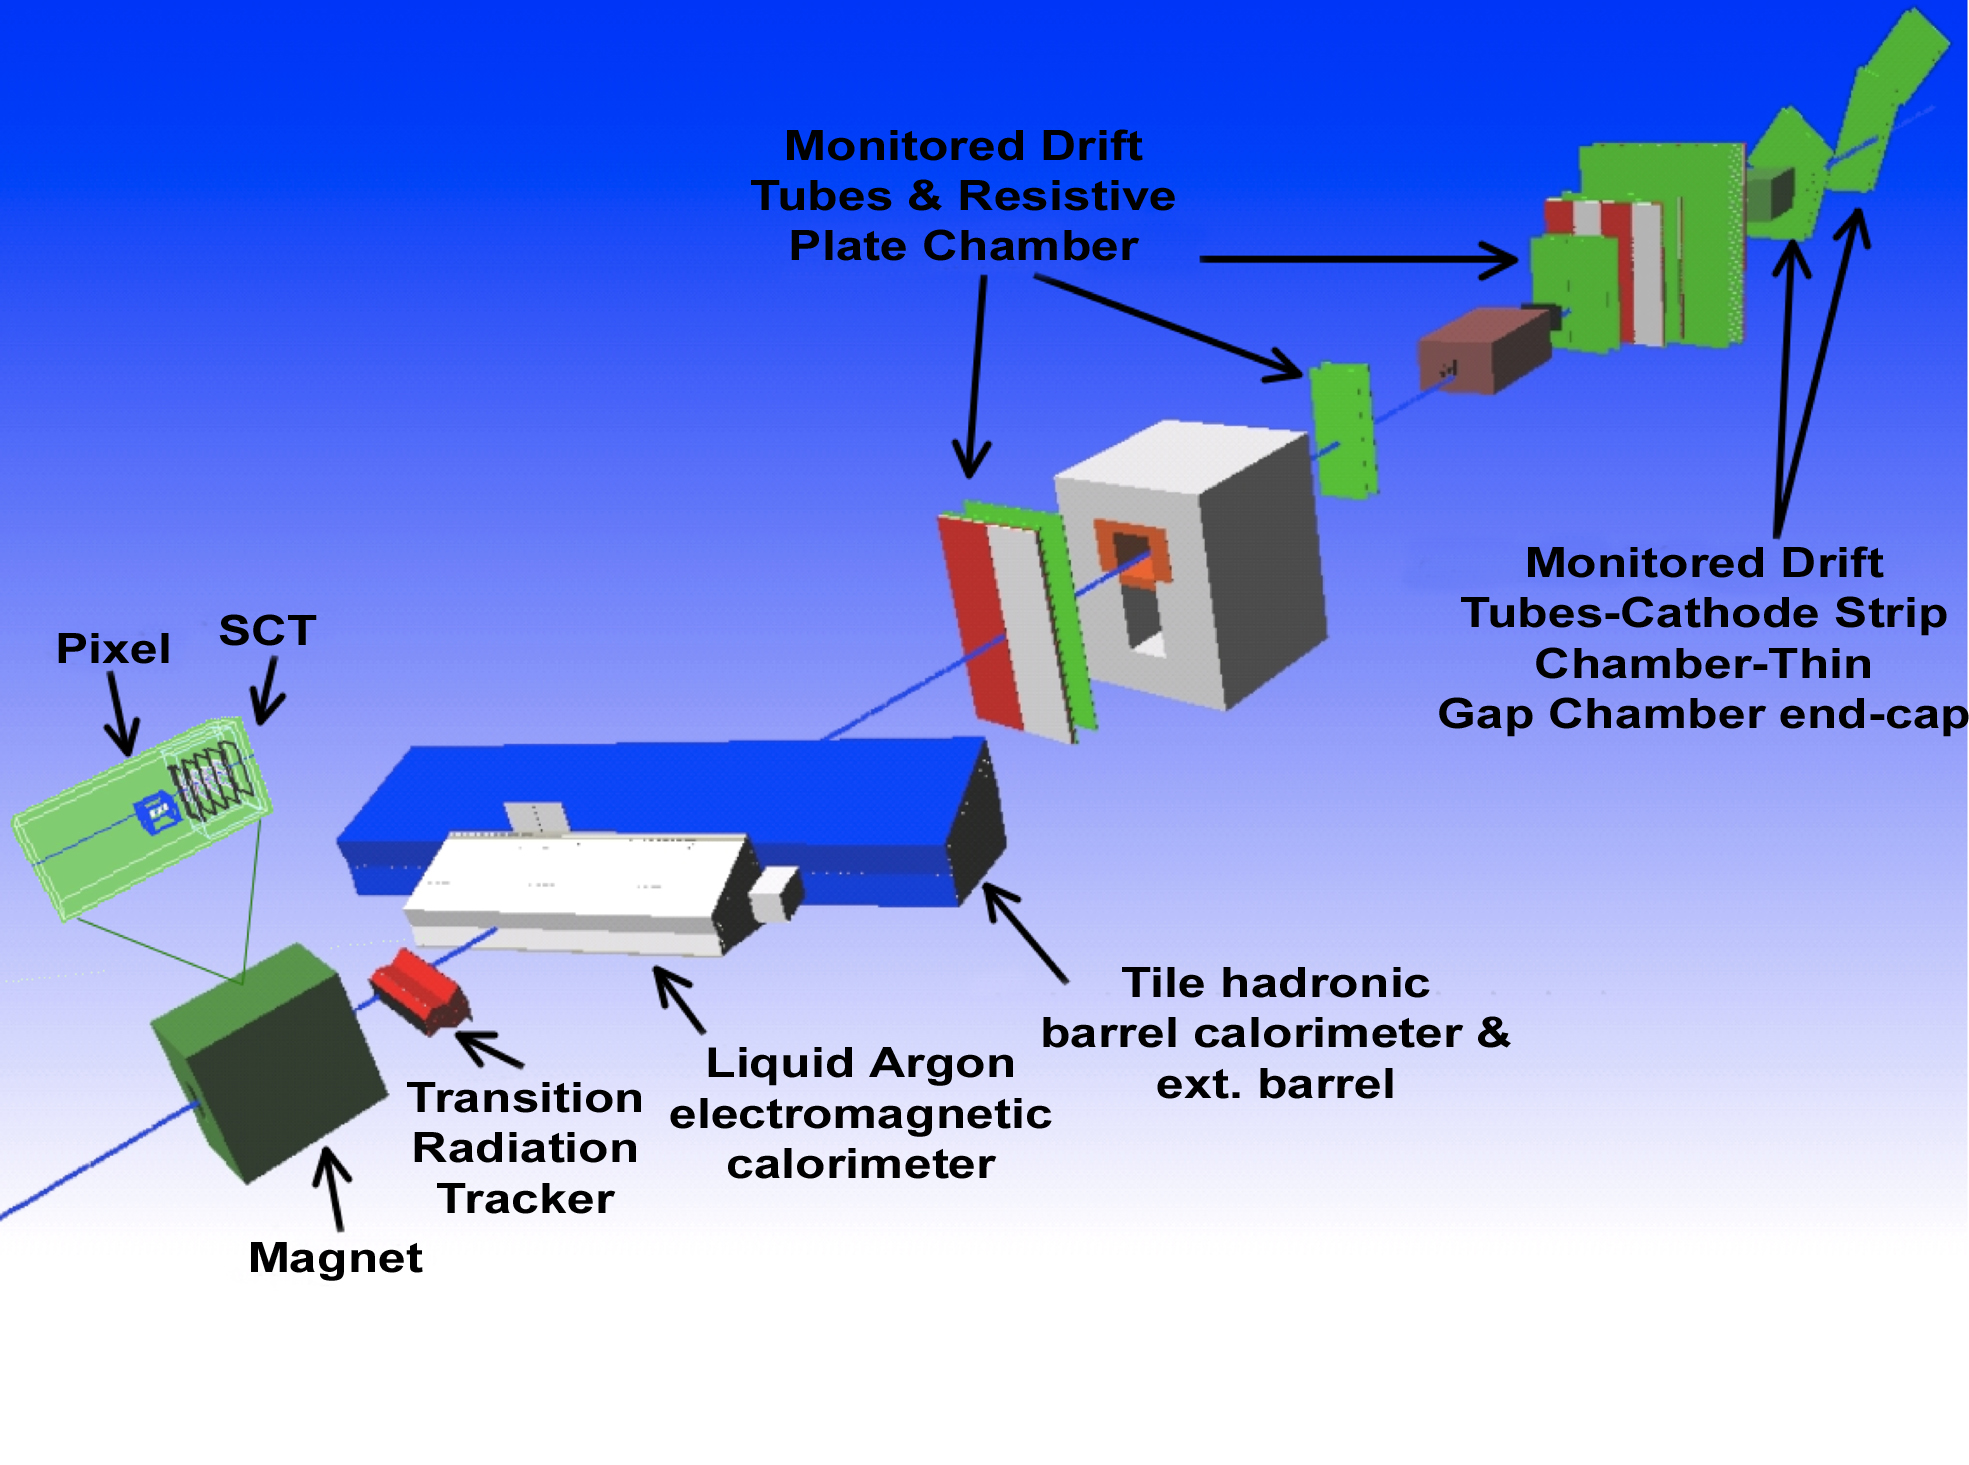
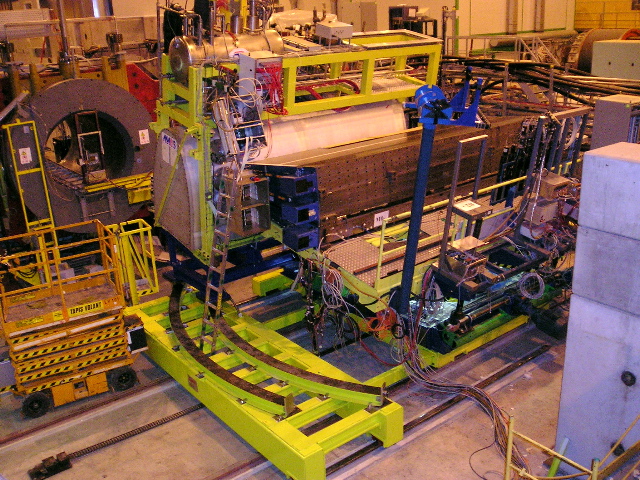
Layout of setup (not showing the Cherenkov detector) and the photo of actual situation at CERNs H8 testbeam facility.
The data:
The testbeam data for this project was taken at a beam energy of 2 GeV. Single particles were sent through the detector layers, and for each particle passing into the detector slice, the following numbers (among 100s of others!) were recorded:
- Cherenkov counts (1 number). The Cherenkov counter reacts on particles, which travels faster than the speed of light IN THAT MEDIUM, thus electrons will tend to give a larger signal.
- Transition Radiation Tracker (2 numbers, both integer). Number of hits for tracking in the TRT (first) and number of High Threshold (HT) hits (second) for identifying electrons, since these have a higher chance of creating such a hit.
- ElectroMagnetic Calorimeter (4 numbers). This type of detector stops particles interacting electromagnetically (i.e. electrons), which thus tend to deposit their energy AS EARLY as possible. The four numbers correspond to the energy deposit (in GeV) in each of the 4 layers of the ATLAS EM calorimeter.
- Hadronic Calorimeter (3 numbers). Much thicker than the EM calorimeter, this detector stops all particles except muons with more than 3-4 GeV in energy. Gives no signal, if no particle reaches the detector. Electrons hardly ever reach this detector.
- Muon detector (1 number). If a muons passes through, this detector gives a higher signal than when not. However, the coverage of the muon detector used was very small, and thus not all muons gives a signal.
Note:
The Cherenkov counter is not part of the ATLAS detector, but simply put into the beam in order to make the task of identifying particles easier.
For an illustration of particle interactions:
Suggestive project questions:
Generally, this project is about separating electrons and pions (and determining how well this can be done), followed by a few questions characterizing the detector response to each type of particle.
Below are some leading questions, some/most of which your project should cover, but you do not have to follow them blindly (I've put "Optional" on those that are not essential).
Your report should be very short (3 pages), explaining how you analysed this data, and what your conclusions were. Possibly a few figures and a table of efficiencies, rejection factors, sample sizes, etc. should/could be included.
- Start by considering the data, and get a feel for the typical range
of each variable. Plot the variables! From considering these plots,
guess/estimate an approximate knowledge of how electrons and pions
distribute themselves in the variables above, and how to make a
selection of these.
As described above, the three detectors, Cherenkov, TRT and ECal are each capable of separating electrons and pions. As they are INDEPENDENT (three separate detectors), they may be used to cross check each other, and this is what you should use!
Find for each of these three detector systems one variable, which seem to separate electrons and pions best. For example, start with the Cherenkov, which is only a single number, and assume/guess that the large peak at low values is mainly from pions, while the upper tail is from electrons.
Now plot the TRT and ECal distributions when the Cherenkov selects a pion and afterwards an electron. This should give you a hint of how to separate pions and electrons using the TRT and ECal.
Hint: Sometimes variables from a single detector are more powerful, when they are taken ratios of. For the TRT this may be somewhat obvious, but for the LAr, it is not as simple. While one may simply use the second layer, involving this layer in a ratio may enhance the separation power.
- Next you should try to see, if you can make a selection, which gives
you a fairly large and clean electron and pion sample, respectively.
The question is, how can you know how clean your sample is and how
efficient your selection is?
This can actually be measured in the data itself, using the fact that there are three independent detectors. For example, start by making an electron and a pion selection using two of the three variables, and plot the third variable for each of these selections. Now you can directly see, how electrons and pions will distribute themselves in this third variable. Are you worried, that there are pions in your electron sample, and vice versa? Well, there will probably be, but so few, that it won't matter, at least not to begin with.
For let us assume that for each detector, 80% of electrons pass your requirement, but also 10% of pions do. Assuming an even number of electrons and pions (which is not really the case), then with two detector cuts, you should get a sample, which is: 0.8*0.8 / (0.8*0.8 + 0.1*0.1) = 98.5% pure
Now with this sample based on cuts on the two other detectors, ask what fraction of electrons and pions passes your electron selection. The fraction of electrons, that are not selected as electrons will be your TYPE I errors, denoted alpha, while the fraction of pions, that do pass the cut will be your TYPE II errors, denoted beta.
Measure these for each of the two cuts in the three detector types, and ask yourself if they are "reasonable", i.e. something like in the example above. If not, then you should perhaps reconsider adjusting your cuts.
By now, you should for each detector have 6 numbers:
- The electron cut value above which you accept an electron.
- The efficiency (i.e. 1-alpha) for electrons of this cut.
- The fake rate (i.e. beta) for pions of this cut.
- The pion cut value below which you accept a pion.
- The efficiency (i.e. 1-alpha) for pions of this cut.
- The fake rate (i.e. beta) for electrons of this cut.
Put these 18 numbers into a nice table in your report. They sum up what you have done, and how well it works!
- Given the efficiencies and fake rates of each cut, try to combine
these (again assuming that they are independent) into knowledge
of your sample purities and also the total number of electrons and
pions in the whole sample. Do the sum of estimated electrons and
pions added actually match the number of particles in total? This
is a good cross check!
- If the number of pions was suddenly 1.000 that of elections, would
you still be able to get a sample of fairly pure electrons? And if
so, what would the efficiency for these electrons be?
- (Optional)
The three detectors, Cherenkov, TRT and ECal are each capable of
separating electrons and pions. But which one is best? Try to get
a ROC-curve for each of the three detectors (i.e. by varying the
selection cut and recalculating the alpha and beta), and compare
these.
- One of the purposes of the testbeam what to measure the response of
the TRT detector to exactly electrons and pions. Omitting the TRT
from the particle selection, how good is the pion rejection in the
TRT, when a 90% electron efficiency is required? That is, when alpha
is 0.10, how low a value for beta do you get?
- Try to select pions using three different (mutually exclusive) techniques:
a) Passing only a hadronic calorimeter requirement (which is that the sum of the three HCal values is above some minimum energy).
b) Passing only Cherenkov AND ECal requirements.
c) Passing both a) and b).
Try to measure the HT probability (i.e. fraction of High-Threshold hits) for each of these pion samples. Do they agree with each other?
- (Optinal)
Try to take a sample of events, where there are exactly 33 TRT hits,
and plot the number of HT hits. Given that there are both electrons
and pions in the sample (each with a different HT probability), this
should be a combination of two Poisson distributions.
Try to fit the number of HT hits with two Poisson distributions combined.
Do they fit the data? And what is then the probability for a HT hit
for pions and electrons (including errors)?
These probabilities could also be measured simply by selecting pure samples of pions and electrons using other detectors, and then looking at the HT probability in these. Which is more precise?
Given your knowledge of the sample purities, you might add a systematic uncertainty (and correction?) to the latter estimate.
Finally, assuming that the number of TRT hits is independent of particle type, the double Poisson fit can actually be used to estimate the fraction of pions and electrons in the sample. Do this, and compare it to your answer in 3). Do they agree?
Perhaps retry with other values for the number of TRT hits...
Data sets:
Below are the files needed for starting the project. The ROOT macro will loop over the data files, but it is for you to write the analysis part.
PRL Latex template:
The project should be written in Physical Review Letter style (or something close to it, if you don't like Latex), and below you can find the files needed (works with pdftex as well, except for the figures, which needs to be converted into .pdf or .png):
Comments:
Enjoy, have fun, and throw yourself without worries at the data.
Last updated 19th of September 2011.