Applied Statistics - From data to results (Fall 2013)
Here is the associated data file to the exam.
General information:
| Lecturer: | Troels C. Petersen (NBI High Energy Physics (HEP)) (petersen |
| Additional teacher: | Lars Egholm Pedersen (NBI High Energy Physics (HEP)) (egholm |
| When: | Monday 9-12, Tuesday 13-17, and Friday 9-12 (Week Schedule Group B). |
| Where: | Auditorium M (Building M at NBI). |
| Period: | Blok 1 (2nd of September - 1st of November 2013), 9 weeks. |
| Evaluation: | Problem set (15%), Projects (15% each), Take-home exam (55%). |
| Exam: | Take-home (24 hour) exam given Thursday the 31st of October 2013 at 8:15. |
| Censur: | Internal censor evaluation (following the Danish 7-step scale) |
| Credits: | 7.5 ECTS (i.e. 1/8 academic years work). |
| Level: | Intended for students at 3rd - 5th year of studies and new Ph.D. students. |
| Prerequisites: | Simple mathematics and some programming (any language, but see below). |
| Note: Programming is an essential tool and is therefore necessary for the course!!! | |
| Programs used: | Simple python and the CERN software ROOT. |
| Text book: | Roger Barlow: Statistics: A guide to the use of statistics. |
| Additional litterature: | Philip R. Bevington: Data Reduction and Error Analysis. |
| Glen Cowan: Statistical Data Analysis. | |
| Pensum/Curriculum: | The course curriculum can be found here. |
| Outline: | Graduate statistics course giving an advanced introduction to data analysis. |
| Course format: | Shorter lectures followed by computer exercises and discussion. |
| Key words: | PDF, Uncertainties, Correlation, Chi-Square, Likelihood, Fitting, Monte Carlo. |
| Language: | Danish (English if requested). All exercises, problem sets, exams, notes, etc. are in English. |
Further information can be found here: Applied Statistics course information
A semi-mandatory "course introduction" questionnaire can be found at: http://goo.gl/8CA9tU
Introduction to Python and ROOT:
Course outline:
Week 0: (Pre-course-start-session)
27 (10:15-12:00): Setting up computers, introduction to Python/ROOT (Aud. M).
29 (10:15-12:00): Introduction, tips and trick in Python programming (Aud. M).
Week 1 (Introduction, general concepts)
2 8:15: Intro to course, photos, questionnaire and table measurements (Aud. A).
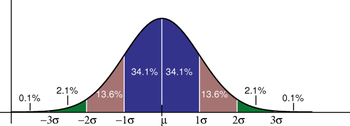
Central limit theorem. Mean, RMS and estimators. Correlation.
3: Error propagation (which is a science!) and Python+ROOT tutorial.
6: Probability Density Functions (PDF) and often used distributions.
Week 2 (ChiSquare, Systematic Errors)
9: Start project 1 (for Friday the 20th of September) doing experiments in First Lab.
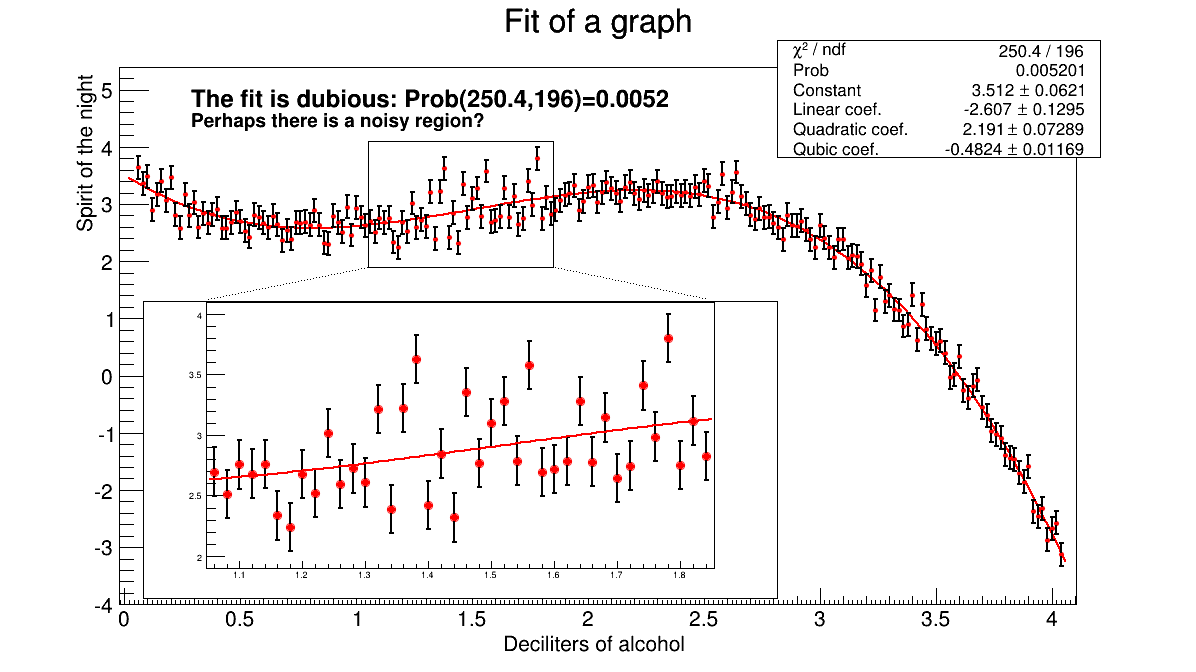
10: Least squares method and (ChiSquare) fitting data (which is an art!).
13: Systematic errors. Possibly (re-)doing project 1 experiments in First Lab.
Week 3 (Likelihood, Fitting, Using Simulation):
16: Maximum likelihood and (more) fitting.
17: Random numbers and their use in MC.
20: Producing random numbers (handing in project 1). Handing out problem set (for Wednesday the 2nd of October).
Week 4 (Hypothesis Testing):
23: Hypothesis testing. Simple, Chi-Square, Kolmogorov and runs tests.
24: Exercise with Kolmogorov test. 15-17 Midway repetition.
27: Evaluation of project 1 results. Catching up, including extended examples.
Week 5 (Confidence Intervals and Bayes Theorem):
30: Limits and confidence intervals.
1: Bayes theorem. Separating/classifying events (handing in the problem set Wednesday by midnight).
4: Calibration and use of control channels. Blind analysis. Start project 2 (for Friday the 26th of October).
Week 6 (Classifying events and calibration):
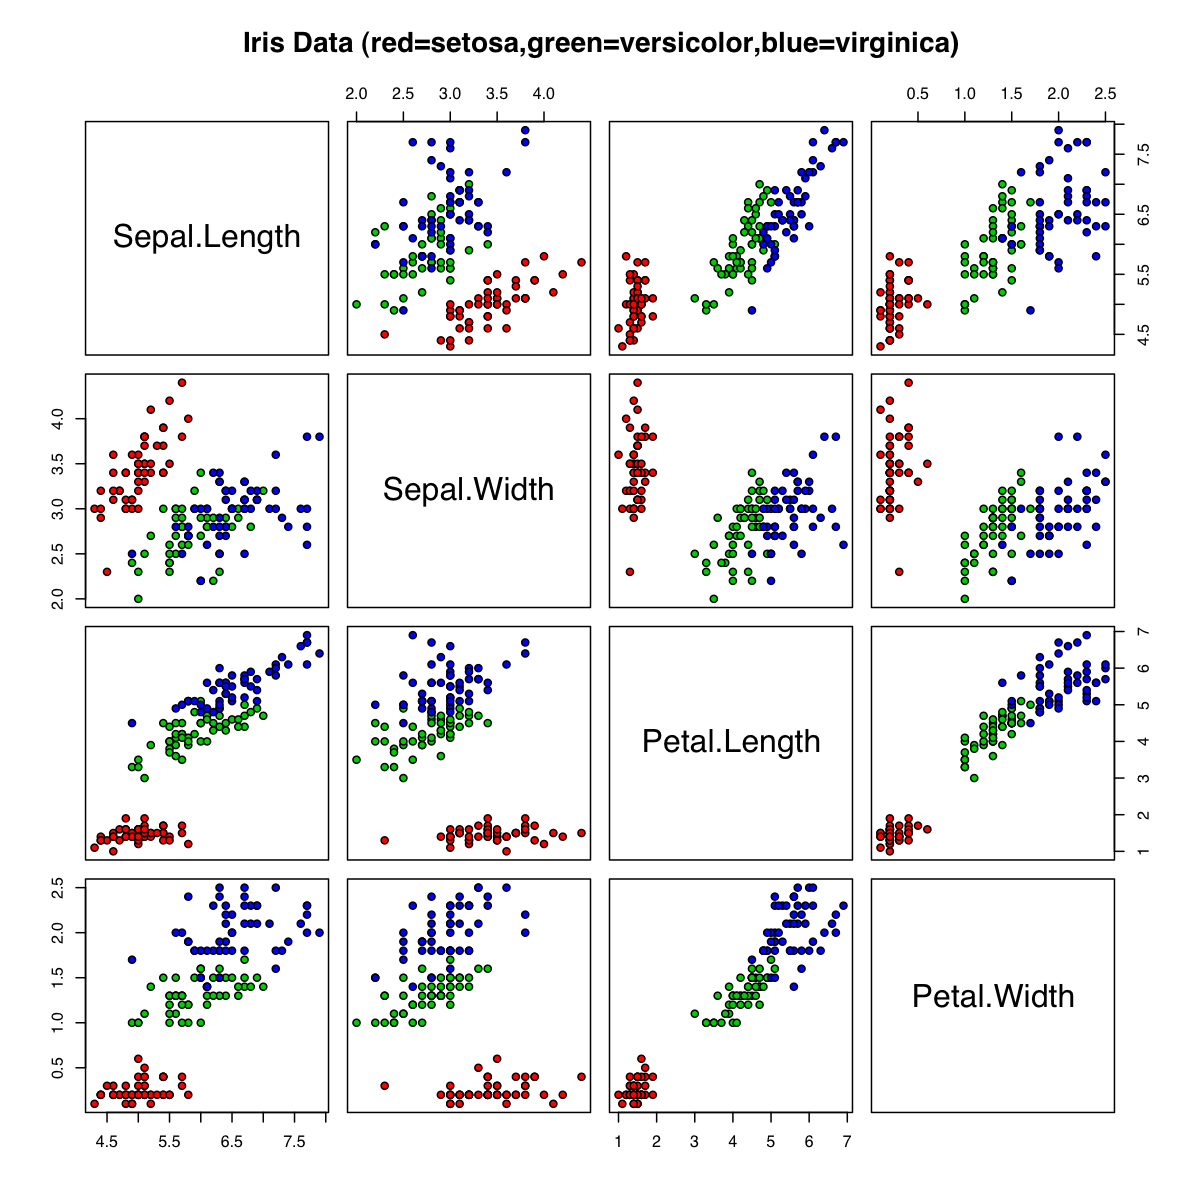
7: Multi-Variate Analysis (MVA) part I. Fisher and ROOT's TMVA. [Lars teaching]
8: Work on 2nd project. [Lars teaching]
11: Multi-Variate Analysis (MVA) part II. Fisher and ROOT's TMVA. [Lars teaching]
Week 7: (efterårsferie/project2)
14:
15:
18:
Week 8 (Project 2 presentations and Fitting):
21: Project 2
22: Designing experiments (inspired by "A lady tasting tea").
25: Project 2 presentations.
Week 9 (Calibration, summary and exam):
28: Sushi and Beer tasting! (hand in project 2 before Sunday midnight)
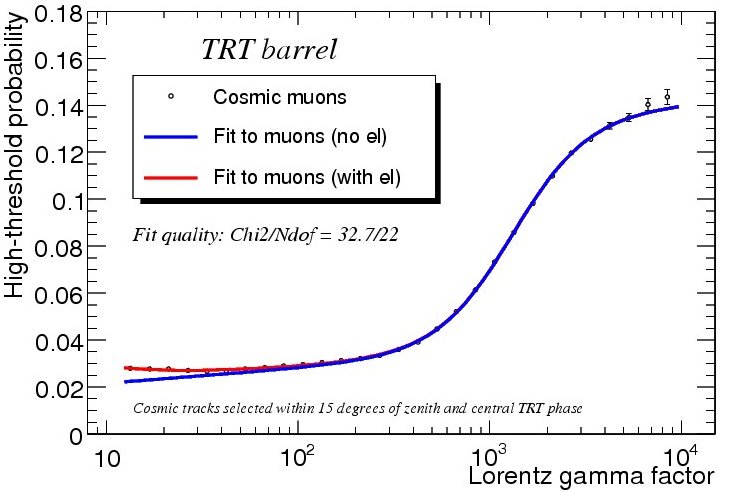
29: Calibration. Summary/repetition of course curriculum.
31: Exam given (posted on course webpage in the morning 8:00).
1: 12:00 Exam to be handed in.
Problem sets, projects, and exam set:
During the course there will be one problem set to be solved, two projects to be carried out, and a final take-home exam to be handed in, all of which can (in due time) be found below:
Solution Suggestions/Discussion
Useful links for Python and ROOT:
The most commonly used ROOT objects are listed here:
In addition, one almost always finds answers in Google! Search for it (perhaps even write your question directly or insert your error message), and answers will appear, often from the forum "Stack Overflow".
Notes:
In addition to the text book and other litterature, some notes will be used during the course:
Links:
Comments about course (biased selection!):
|
"This course overqualified me for a course on scientific
computing at Harward the following Summer." [Dennis Christensen (2009 course)] "I recommended this course to everyone I know." [Pernille Yde (2009 course)] "I don't think that you can rightly call yourself a physicist, if you have not had a course of this type." [Bo Frederiksen (2010 course)] "My second project in the course led to an article now in review for Nature magazine!" [Ninna Rossen (2011 course)] "If you really want to understand your data, you need a course like this." [Julius Bier Kirkegaard (2012 course)] |