Applied Statistics - From data to results (Winter 2024-25)
"Essentially, all models are wrong, but some are useful". [George E. P. Box, British Statistician, 1919-2013]  |
 |
 |
 |
 |
 |
| Troels C. Petersen | Mathias Heltberg | Malthe S. Nordentoft | Beatrice J. Geiger | Rashmi Gottumukkala | Marcela Grcic |
| Lecturer | Assistant lecturer | Teaching assistant | Teaching assistant | Teaching assistant | Teaching assistant |
| Associate Professor | Assistant Professor | Ph.D. student | Ph.D. student | Ph.D. student | Ph.D. student |
| High Energy Physics | Bio Complexity | Bio Complexity | Bio Complexity | Astrophysics | Astrophysics |
| Mac user | Mac user | Mac & Linux expert | Windows & Mac expert | Mac & Linux expert | Windows & Mac expert |
| Course responsible | Continuity responsible | GitHub responsible | ProbSet responsible | Exam responsible | Lab coord. responsible |
| 26 28 37 39 | 26 19 18 89 | 28 90 19 02 | 91 95 20 48 | +46 76 9304 197 | |
| petersen |
heltberg |
malthe.nielsen |
beatrice.geiger |
rashmi.gottumukkala |
marcela.grcic |
| Office: NBB-3-I-034 | nbi.ku.dk | nbi.ku.dk | nbi.ku.dk | nbi.ku.dk | nbi.ku.dk |
Course information (What, when, where, prerequisites, books, curriculum, and evaluation):
| Period: | Blok 2 (18th of November 2024 - 17th of January 2025 including exam), 8 weeks total. | |
| When: | Monday 8:15-12:00, Tuesday 13:15-17:00, and Friday 8:15-12:00 (Week Schedule Group B). | |
| Note on morning lectures: After the first three weeks, we will start 9:15 on Mondays and Fridays. | ||
| Where: | Lectures: Aud. 5 at HCO, see also KU Room Schedule plan. | |
| Exercises: HCO (A101, A102, A104, A105) Mondays, BioCenter (4-0-32, 4-0-10) Tuesdays, and DIKU (bib 4-0-17, 1-0-14) Fridays. | ||
| Content: | Graduate statistics course giving an advanced introduction to statistics and data analysis. | |
| Level: | Intended for physics (and science) students at 3rd-5th year of studies and new Ph.D. students. | |
| Prerequisites: | Math (calculus and linear algebra) and programming experience (preferably Python, but there are no language requirement). | |
| Note on prerequisites: Programming is an essential tool and necessary for the course!!! | ||
| Format: | Shorter lectures followed by computer exercises, discussion, and occationally experiments. | |
| Text book: | Roger Barlow: Statistics: A guide to the use of statistics. |
|
| Additional literature: | Glen Cowan: Statistical Data Analysis, which is a shorter, modern introduction to statistics and data analysis. | |
| Software used: | Python (v3.11+) and a few packages on top in Jupyter Notebook (see Nature article). | |
| Exercise/code repository: | All code used for the exercises of the course will be at the AppliedStatisticsNBI GitHub. | |
| Pensum/Curriculum: | The course curriculum covers chapters 1-8 + 10 in Barlow with many exceptions, detailed in the link. | |
| Expected learning: | What I expect you to learn is discussed here: Learning objectives | |
| Evaluation: | Problem set (20%), Project (20%), and take-home exam (60%). | |
| Exam: | Take-home (36 hours!) exam given Thursday the 16th of January 2025 at 8:00 and end on Friday the 17th of January at 20:00. |
Before course start:
For an overview of the course curriculum, please see the overview video (1.1 GB, 12 min.) and overview PDF.
Further course information can be found here: Applied Statistics course information.
The "course introduction" questionnaire to be filled out at: Applied Statistics 2024 Questionaire.
List of things to be done by first day of course (Monday the 20th of November): Applied Statistics check list.
Python specific precourse considerations:
The source of all code for this course is the NBI Applied Statistics github repository.
For a quick introduction to the basic git commands, please see the git cheat sheet.
Check that you have access to ERDA (requires KU ID), as an alternative to running on your own computer. Use "Statistics Notebook with Python".
Also, Install Python as described in README.md in version 3.11+, and put a few packages on top.
User Guides for the Minuit minimisation package with great guides on fitting and speed optimisation: iminuit (2018).
Course outline:
Below is the preliminary course outline (subject to changes and updates throughout the course).
Week 0 (Help with access, setup, programming, concepts, and preparation):
Nov 14: 15:00-16:30: Help with access, setting up Python, programming, course details, and measuring table! (in Auditorium A)
Week 1 (Introduction, General Concepts, ChiSquare Method):
Nov 18: 8:15-10:00: Introduction to course and overview of curriculum (in Auditorium A).
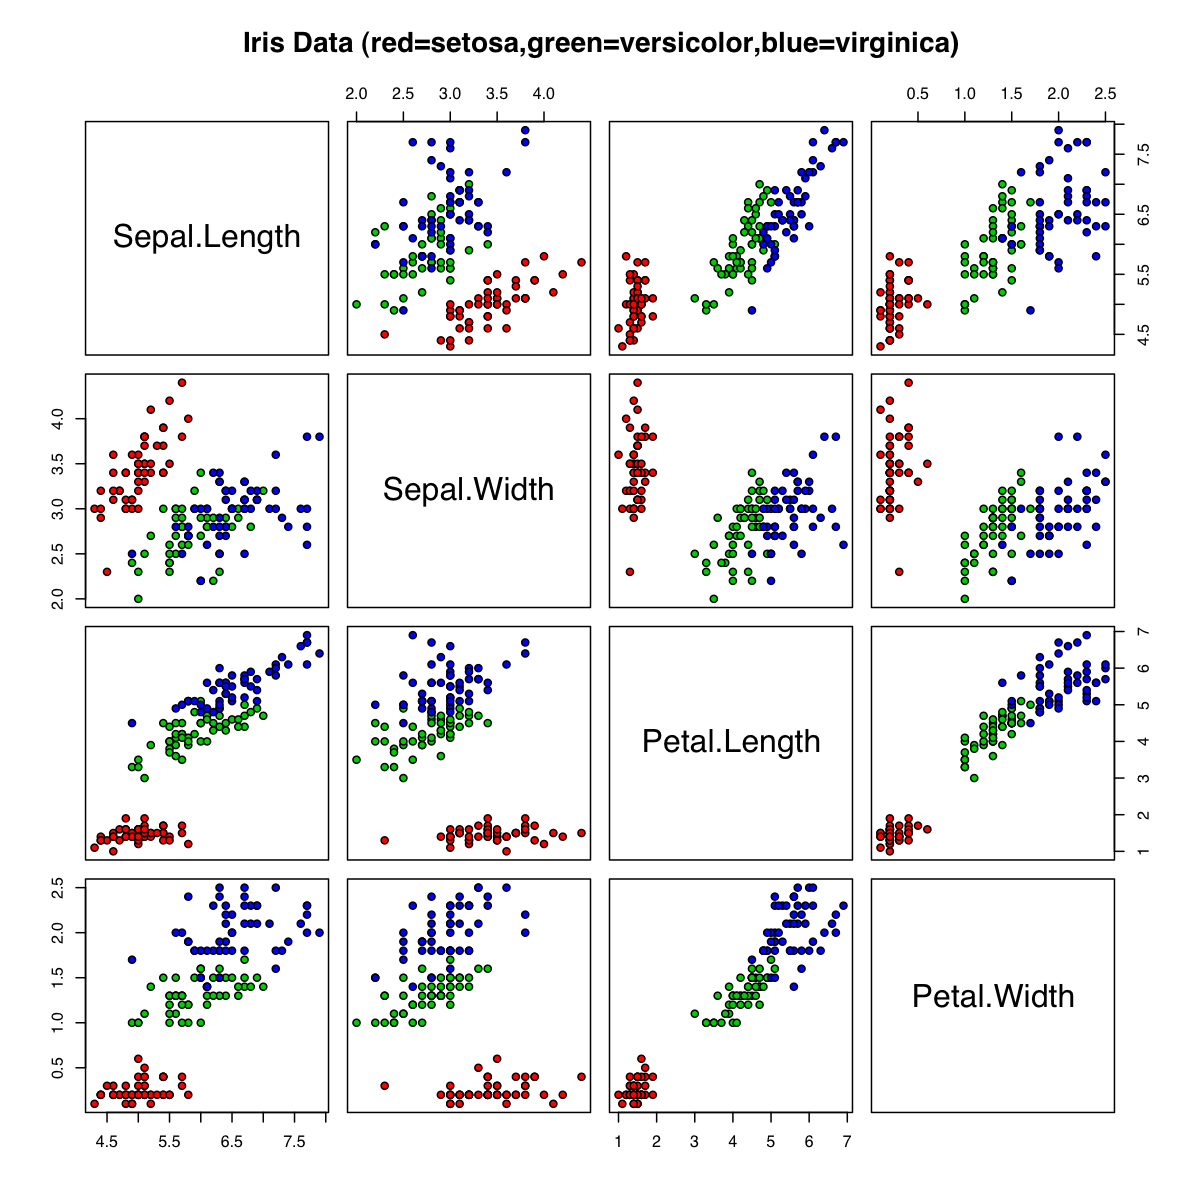
Mean and Standard Deviation. Correlations. Significant digits. Central limit theorem.
Nov 19: Error propagation (which is a science!). Estimate g measurement uncertainties.
Nov 22: ChiSquare method, evaluation, and test. Start formation of Project groups.
Week 2 (PDFs, Likelihood, Systematic Errors):
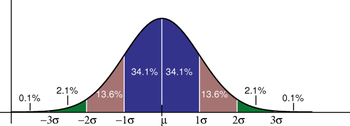
Nov 25: 9:15: Probability Density Functions (PDF) especially Binomial, Poisson and Gaussian.
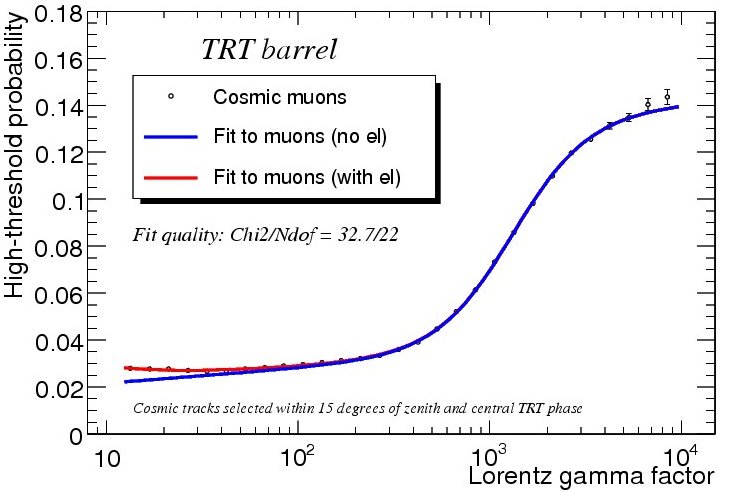
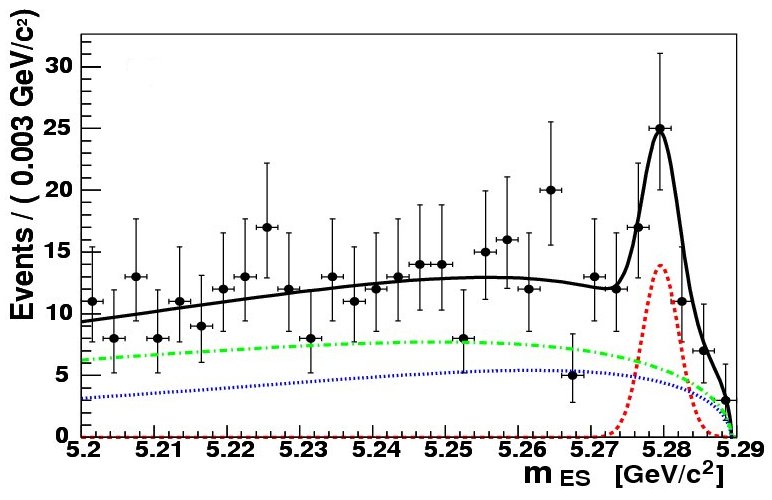
Nov 26: Principle of maximum likelihood and fitting (which is an art!).
Nov 29: 8:15 - Group A: Project (for Saturday the 14th of December) doing experiments in First Lab.
9:15 - Group B: Systematic Uncertainties and analysis of "Table Measurement data" (Mathias) in Aud. A (+B).
Week 3 (Using Simulation and More Fitting):
Dec 2: 8:15 - Group B: Project (for Saturday the 14th of December) doing experiments in First Lab.
9:15 - Group A: Systematic Uncertainties and analysis of "Table Measurement data" (Mathias) in Aud. A (+B).
Dec 3: Producing random numbers and their use in simulations.
Dec 6: Fitting strategies (Note: No more morning lectures starting at 8:15).
Week 4 (Hypothesis Testing, confidence intervals/limits, and Bayesian statistics):
Dec 9: Hypothesis testing. Simple, Chi-Square, Kolmogorov, and runs tests.
Dec 10: Confidence intervals and limits. Testing your own random (?) numbers.
Dec 13: Bayes theorem and Baysian statistics (Mathias).
Projects should be submitted on Absalon by Saturday the 14th of December at 22:00!
Submission of result values for Project.
Submission of result values for Table measurements.
Week 5 (Calibration, Multivariate Analysis, and real data classification/analysis):
Dec 16: Table Measurement solution discussion. Calibration and use of control channels.
Dec 17: Multi-Variate Analysis (MVA). The linear (Fisher) discriminant (compared to PCA).
Dec 20: Discussion of Problem Set. Analysis of real and complex data on separating/classifying events. Analysis of testbeam data.
For exam training, here is Exam2016.pdf.
Here is the associated problem 4.1 data file.
Here is the associated problem 5.1 data file.
Here is the associated problem 5.2 data file.
Here is an approximate solution manual.
Week 6 (Introduction to Machine Learning and real data classification/analysis):
Jan 3: Machine Learning (ML). Neural Networks, Decision Trees and other MLs. Exercise: ML and/or Problem Set!
Problem set should be submitted by Friday the 3rd of January at 22:00!
Week 7 (Advanced fitting, Problem Set deliberation, and time series):
Jan 6: Stratification - beating sqrt(N). Discussion of selected parts of course curriculum. Exercise on simulation.
Jan 7: Advanced fitting with both functions, models, and in 2D. Discussion of Analysis of testbeam data.
Jan 10: Time series analysis (Mathias).
Week 8 (Fitting and exam):
Jan 13: Discussion of Problem Set solution. Deliberation on previous (2016) exam. Discussion of fitting philosophy.
Jan 14: Simpson's Paradox. Exam questions. Catch up on exercises.
Jan 16: Exam given (posted on course webpage 8:00 in the morning).
Jan 17: 20:00 Exam to be handed in (on www.eksamen.ku.dk).
Notes and links:
In addition to the text book and other literature, some notes may be useful during the course:
Course comments/praise (very biased selection!):
|
"Kaere Troels. Jeg skriver til dig fordi jeg tog dit kursus, 'Anvendt statistik' tilbage i 2012.
Jeg var (er) meget begejstret for det kursus og har brugt den viden utallige gange siden." [Rune Gjermundbo, Director of Business Operations, in 2023] "Hej Troels. Jeg tænkte på, om ikke du ville sende mig linket til din AppStat 2022 hjemmeside? Jeg har tilsyneladende forlagt det, og der er simpelthen så meget guld derinde. :D" [Sarah Andersson, Operations Engineer at Netcompany, in 2024] Comments from previous years |
Last updated 7th of November 2024.